Self-Organizing Maps
This study investigates the application of a machine learning technique called Self-Organizing Map (SOM) for the optimal allocation of architectural functions in buildings through volumetric clustering based on daylight requirements.
A Self-Organizing Map is an unsupervised learning technique that is usually employed to visualize data through a reduced dimensional representation, for example, a 2D map. Dimensional reduction is useful when the input data have a high number of dimensions, which makes visualization difficult. Similar to Neural Networks (NN), SOM consists of nodes (the neurons) and associated weight vectors. Nodes can be arranged as needed for the representation, for example as a rectangular grid of points. Each node is associated with a weight vector that has the same dimension of the data in the input space. As for NN, SOM operates by training and mapping. Training consists of generating a low-dimensional map of the input data and it is based on competitive learning. When a training sample is fed to the network, the distance between the input weight and all other weight vectors is computed to identify the node whose weight vector is the closest to the input, i.e. the best matching unit (BMU). At each iteration, there is one BMU that has a certain radius of influence (neighborhood). A Mexican-hat function is typically adopted to compute the change of the weight vectors based on the distance from the BMU. The weight vectors of the nodes closest to the BMU are adjusted towards the input weight. As the distance from the BMU increases, the magnitude of change decreases until it becomes negative (inhibitory feedback). This means that for the nodes outside the BMU neighborhood, the weight vectors are adjusted to be different from the input weight. The magnitude of changes for the weights in the network decreases with time (iterations). This process repeats for each data input. The map converges distributing the features (weights) of the input data into clusters. In other words, the input data set is represented through grouping observations in clusters of similar values obtaining a semantic map that might facilitate the understanding of the data set structure. A new input data can then be classified by identifying the node having the closest weight vector to the input.
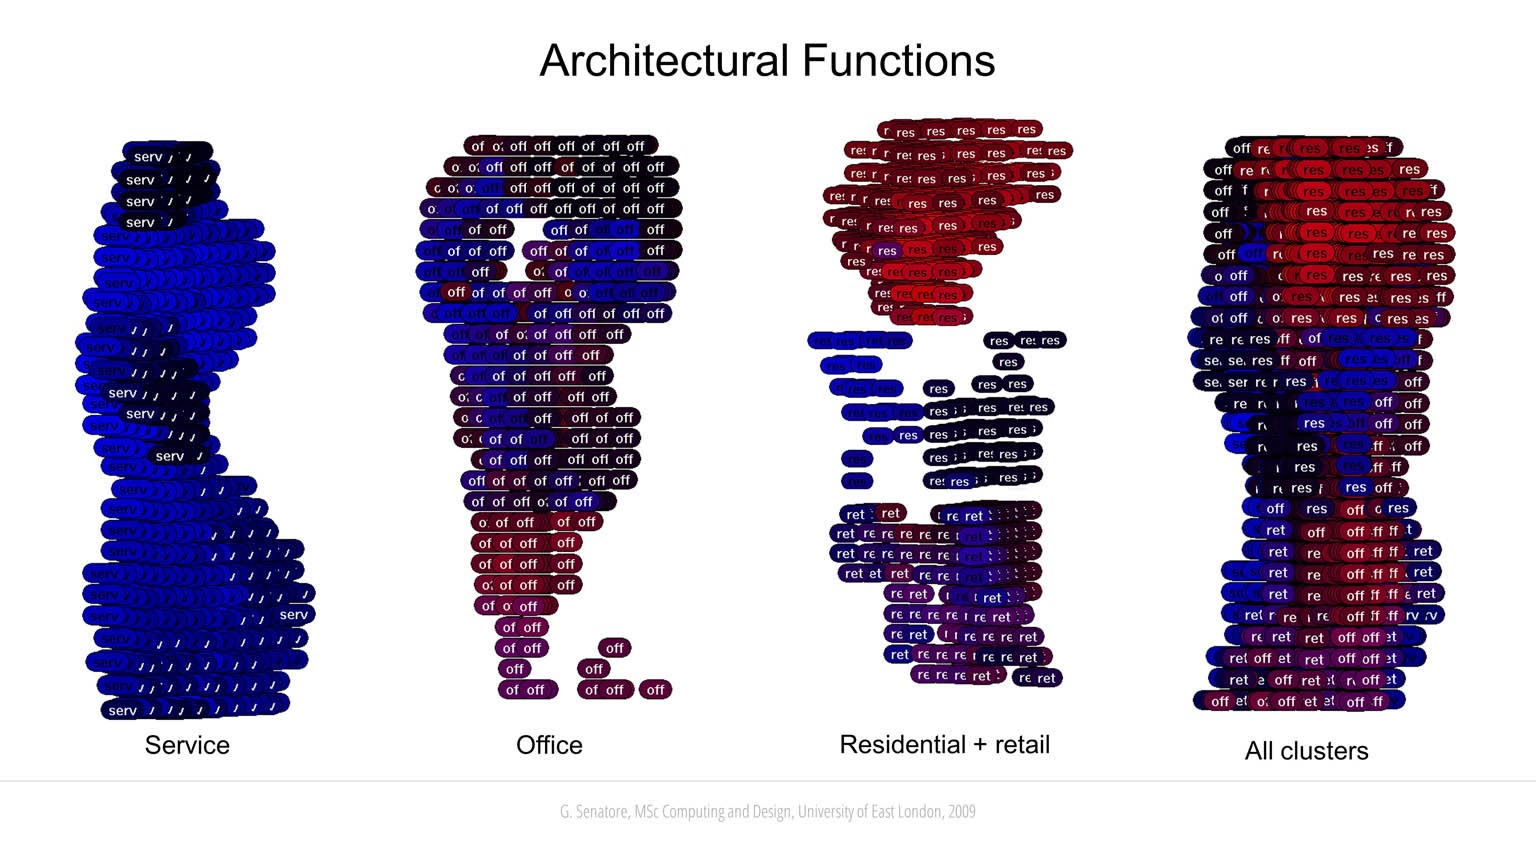
The input data vector can be any data type including, for example, geometric objects, as long as a distance measure can be defined and associated with the weight vector. In this work, the input data is a solar radiation map computed on the envelope of a building through daylight analysis. Refer to one of the examples shown in Evolutionary Computation. The building envelope is represented through a mesh geometry comprising faces and vertices. The network consists of a 3D grid of nodes that fills approximately the internal volume of the envelope mesh. The input space consists of 3-dimensional vectors that indicate the solar radiation associated with the neighboring faces of each mesh vertex through RGB color values. Training of the SOM is carried out to obtain a subdivision of the volumetric space (the map space) based on the input space (the solar radiation map). To map the input vectors into clusters that can be related to an architectural program the input space is divided into four sub-spaces: 1) residential, 2) office, 3) retail and 4) service, which are assigned proportionally to the level of daylight requirements. The initial value for the weight vectors is set to be RGB(0,0,0). A constraint on retail function is set to avoid allocation above a certain height. A common feature among the solutions obtained through training is the location of the residential cluster at upper levels and on the south-facing side of the building, while the service cluster is typically located on the north-facing side of the building. Function allocation results from a negotiation between the ability of the network to cluster the input features (solar gain map) and the constraints given by the architectural program.
Acknowledgments
Gennaro Senatore carried out this research for his Master of Science in “Computing and Design” at the University of East London.
Team
Research Lead:
Gennaro Senatore
Advisors:
Paul Coates, Christian Derix | University of East London